Five Places Data Can Take You

These five dashboards all start with the same question: where can my data take me?

Five builds, five domains — the map changes, the question underneath doesn't.

Some names and places below have been changed, and the figures may be representative rather than exact — enough to show how each dashboard works, not to disclose client data.

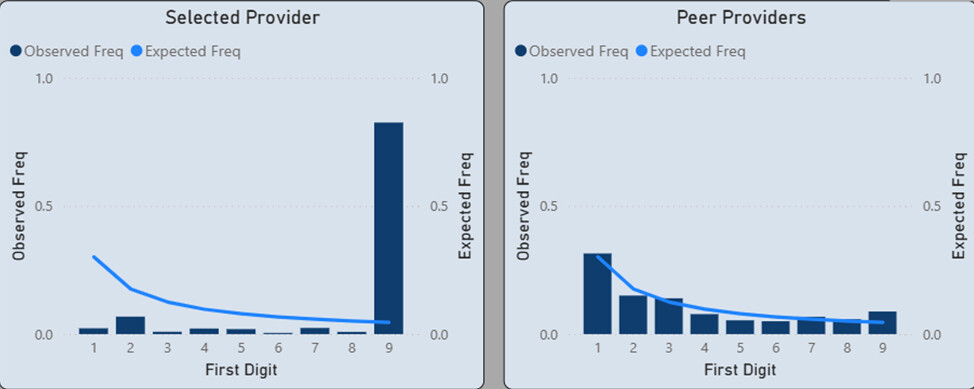
Power BI Benford's Law chart comparing one provider's digit distribution to the expected curve, side by side with the peer-provider group
WPT-01 · AUDIT & COMPLIANCE

Fraud, Waste & Abuse Detection

Benford's Law is a quiet, well-documented quirk of honest numbers: in real financial data, leading digits follow a predictable curve, and figures picked to look random rarely do. DANdata builds Power BI models that plot a provider's digit pattern against that expected curve — and against a whole peer group at once — so an unusual pattern is easier to catch early, instead of after a lengthy investigation.

READOUTScreens thousands of claims against dozens of peer providers, digit by digit, in a single view.
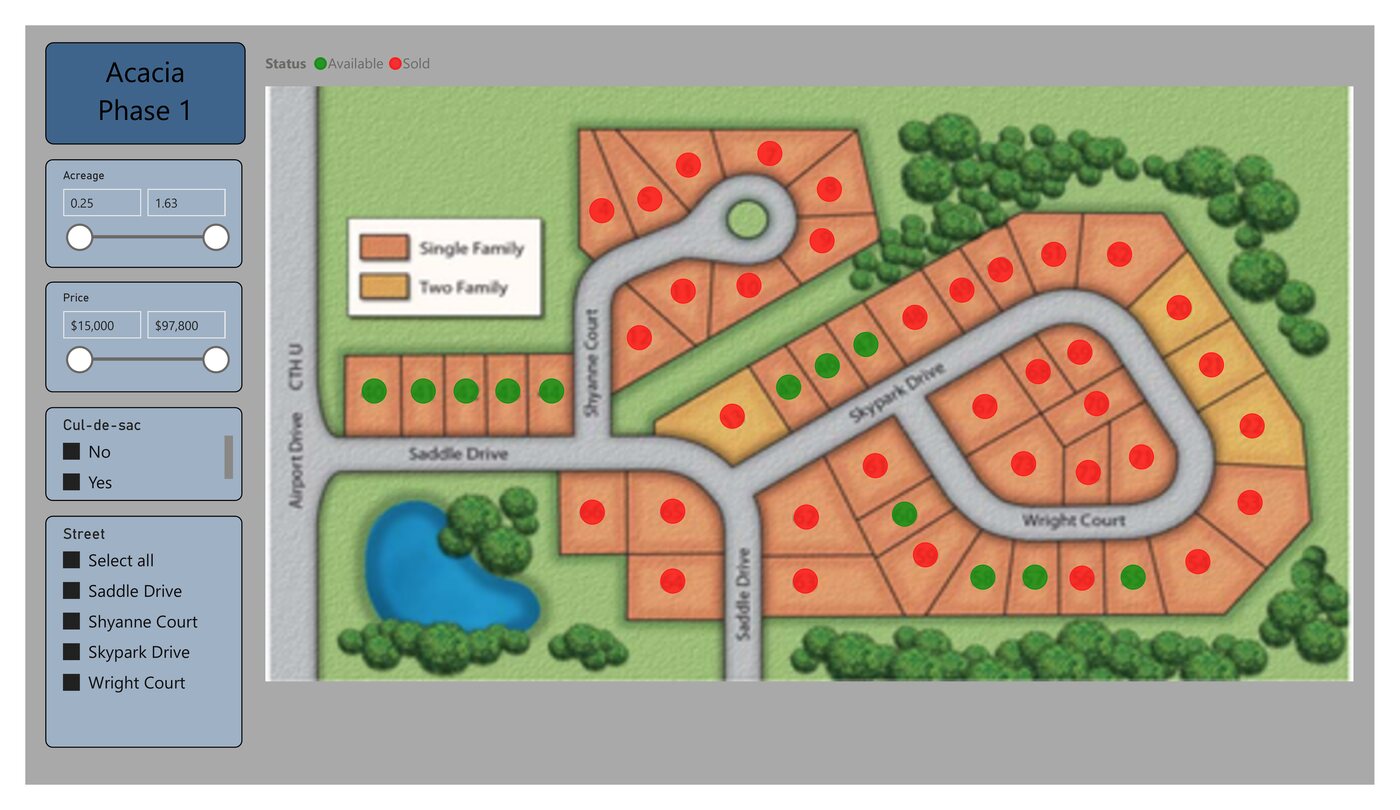
Interactive Power BI plat map of the Acacia Phase 1 subdivision, filterable by acreage, price, street, and cul-de-sac
WPT-02 · REAL ESTATE

Housing Development Presentation

A spreadsheet of lots doesn't sell anything. For a subdivision like the sample shown here, DANdata turns the plat into an interactive map: every lot colored by status, filterable by acreage, price, street, or whether it backs a cul-de-sac — so a sales team, or a buyer with a tablet, can narrow dozens of lots down to a handful without leaving the map.

READOUTLots filtered live by acreage, price, street, and lot type.
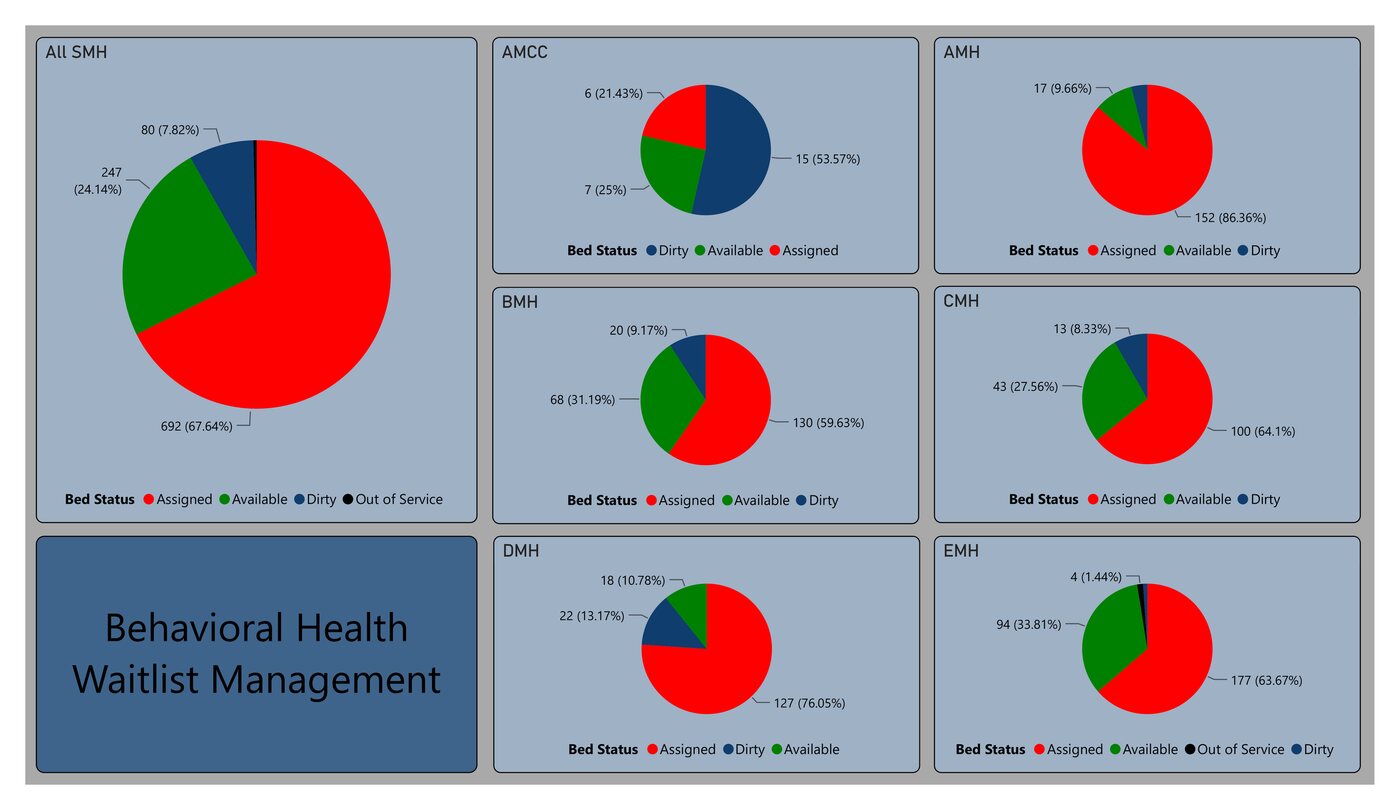
Power BI dashboard of behavioral health bed status by hospital, showing assigned, available, dirty, and out-of-service beds
WPT-03 · HEALTHCARE

Behavioral Health Waitlist Tracking

A hospital network needs to know, at a glance, whether a bed is assigned, available, or waiting on housekeeping — at one campus or across several. DANdata builds views that roll up from a single floor to an entire network, so a waitlist coordinator can see capacity system-wide in one chart instead of wading through lines in a report.

READOUTRolls up bed status — assigned, available, turning over — from a single floor to a full network.
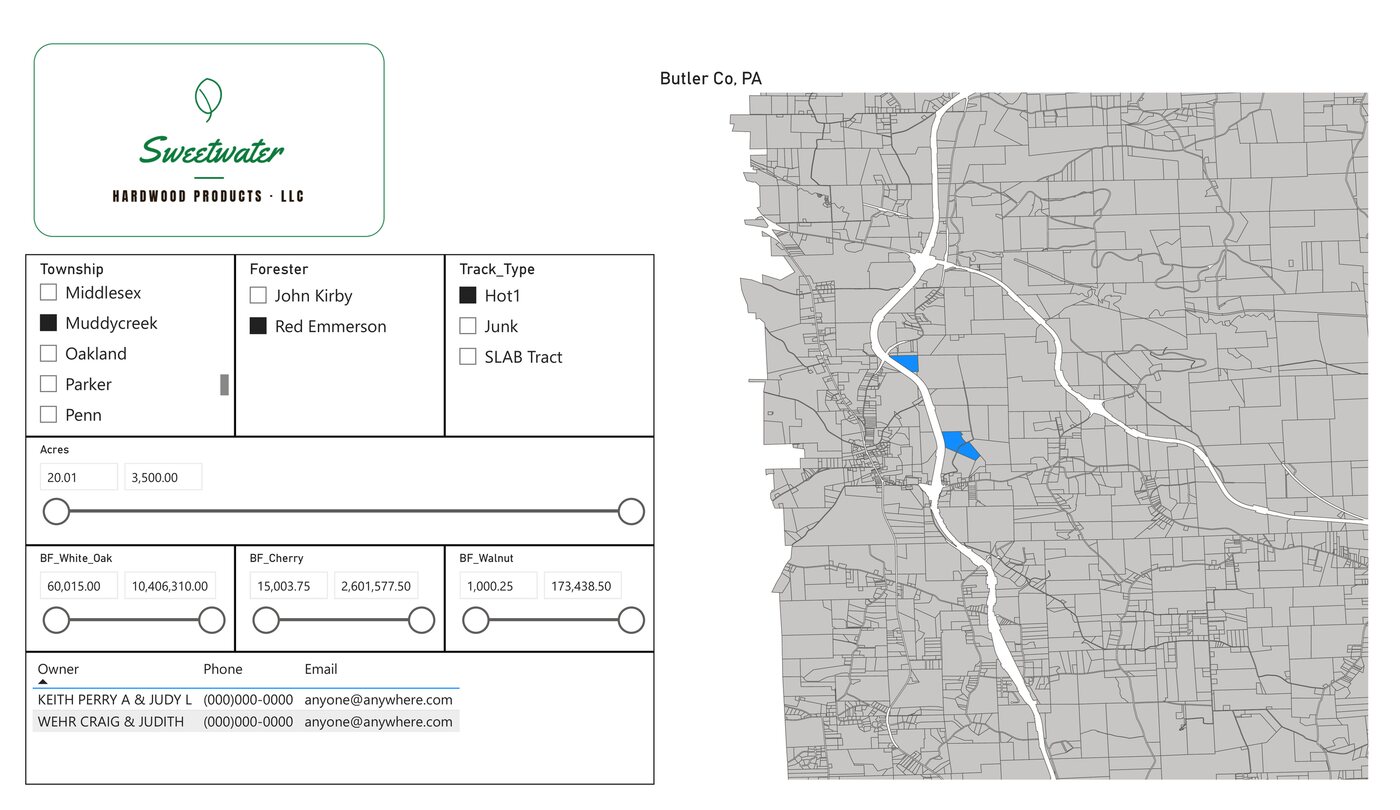
GIS map of timber tracts filterable by township, manager, acreage, and board-feet by species
WPT-04 · FORESTRY & LAND MGMT

Timberlands Management

When someone's already out in the field, a good map answers the next question before they ask it: which other leads nearby are worth a visit, and who do you call? Tracts are cross-referenced by location and manager, filterable by acreage and yield by species, with contact info a click away — turning a day of driving into a planned route.

READOUTTracts filtered by acreage and species yield, mapped by location and manager.
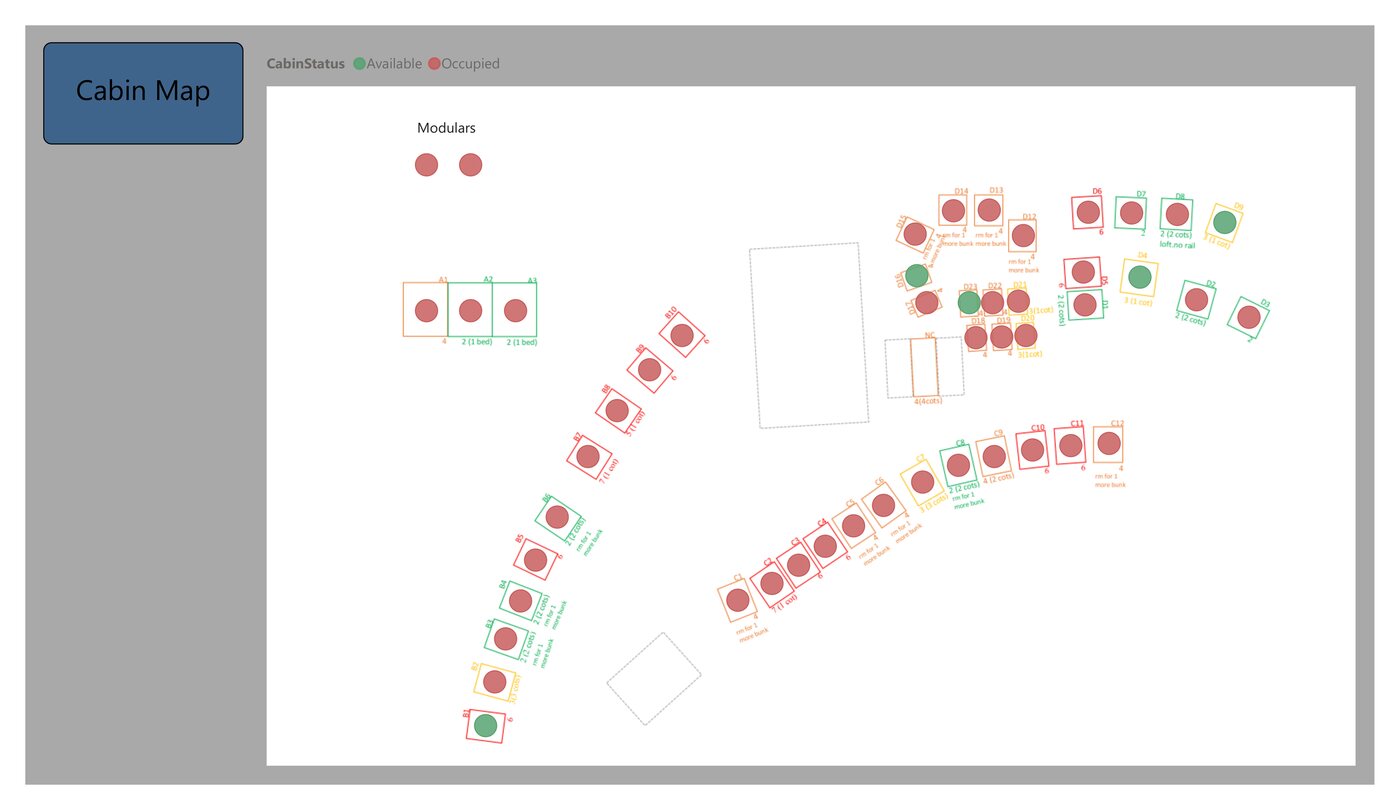
Power BI cabin map for a youth camp, color-coded by occupancy status across four cabin rows and a set of modulars
WPT-05 · HOSPITALITY & CAMPS

Youth Camp Administration

Check-in day means a line of families, a bus of campers, and a staff member trying to remember availability across dozens of cabins, RV hookups, and dorm bunks. DANdata's cabin map replaces the walk-the-grounds headcount with one screen: every cabin color-coded by status and updated near real time as campers check in, so the front desk can assign the next arrival in seconds and answer "do we have room" without leaving the desk.

READOUTAvailability shown across every accommodation type, updated as campers check in.